72-hour pollutant forecast
Hour by hour, three days out. See where the peak lands before you plan the run, the walk or the open window.
iPhone · Apple Watch · Widgets
Air Quality reads the Universal AQI, six pollutants and the pollen count for any place on Earth — 72 hours of pollutant forecast, five days of allergy risk, and health guidance written for your situation rather than the average person's.
The index
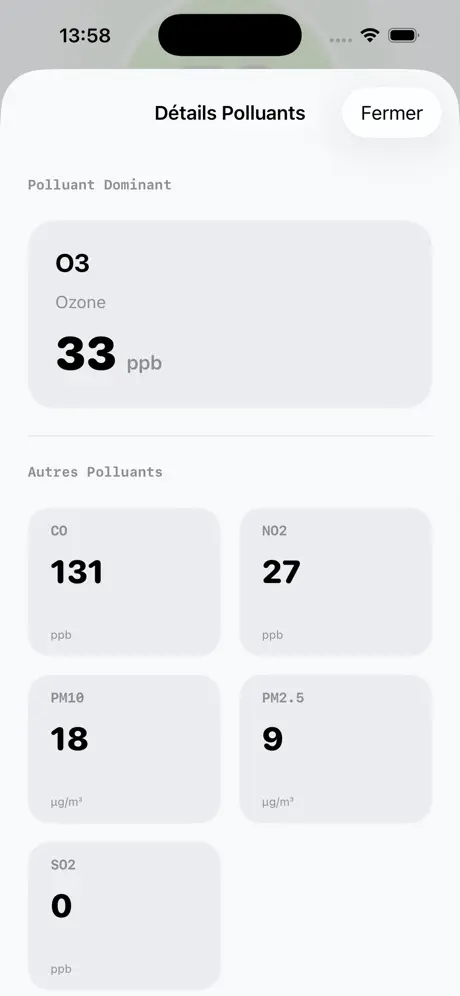
The Universal AQI condenses what is in the air into a single figure — 100 is clean, 0 is not. Air Quality keeps the whole detail underneath it: every concentration, the dominant pollutant, and what the reading actually means for you.
The same air is not the same news for everyone. Air Quality carries the health recommendation for each group, straight from the source, in your language.
Seven recommendations, updated with every reading.
What's inside
Hour by hour, three days out. See where the peak lands before you plan the run, the walk or the open window.
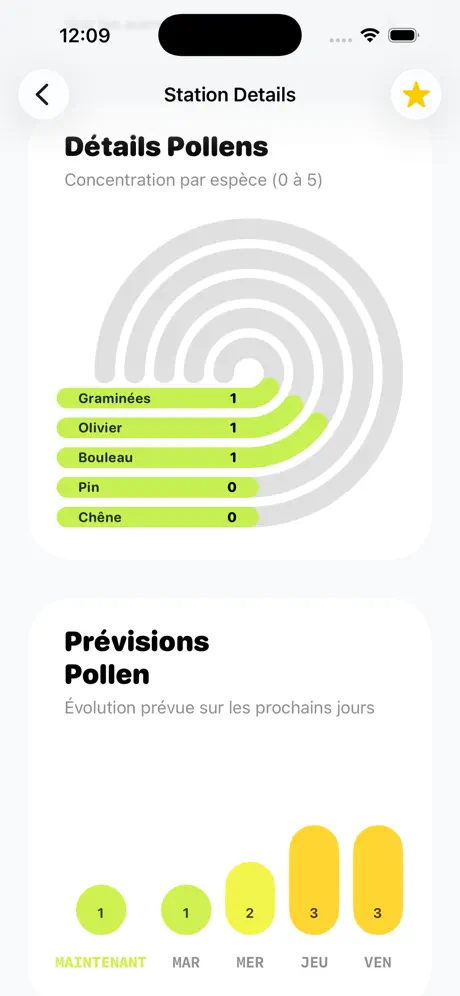
Tree, grass and weed indices for the next five days — birch, plane, ragweed and grasses, species by species on a 0 to 5 scale.
Pan anywhere on Earth and read the air where you land. Switch the overlay between air quality and pollen.
Home, the office, your parents' town. Each saved station keeps its own readings, its own forecast and its own pollen profile.
Pick the hour and the kind of alert. A background refresh checks your saved places and warns you before the level climbs.
Every reading is cached as it arrives. Step into a basement or a plane and the last known figure is still there.
Screens
Every saved place on one screen, the whole continent on the map, and the index on your Home Screen without opening anything.
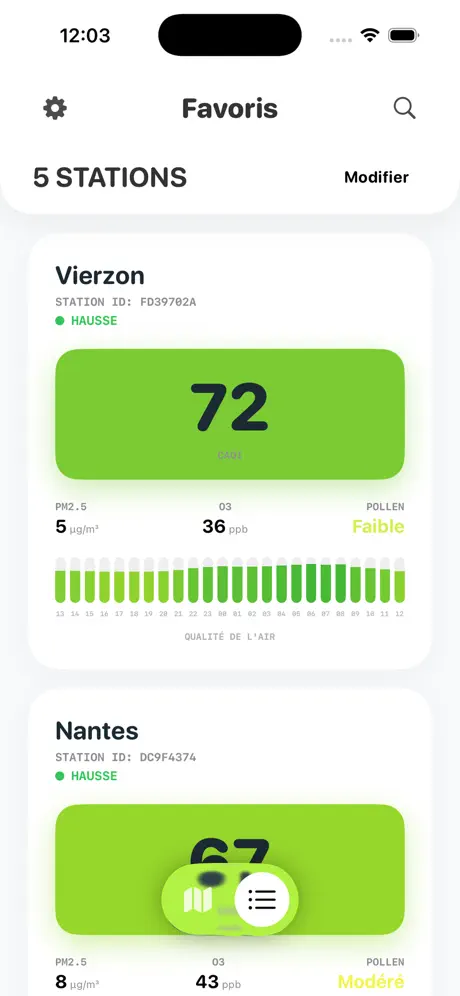
Each saved station shows its index, its dominant readings and its pollen level, with the 24-hour trend drawn underneath.
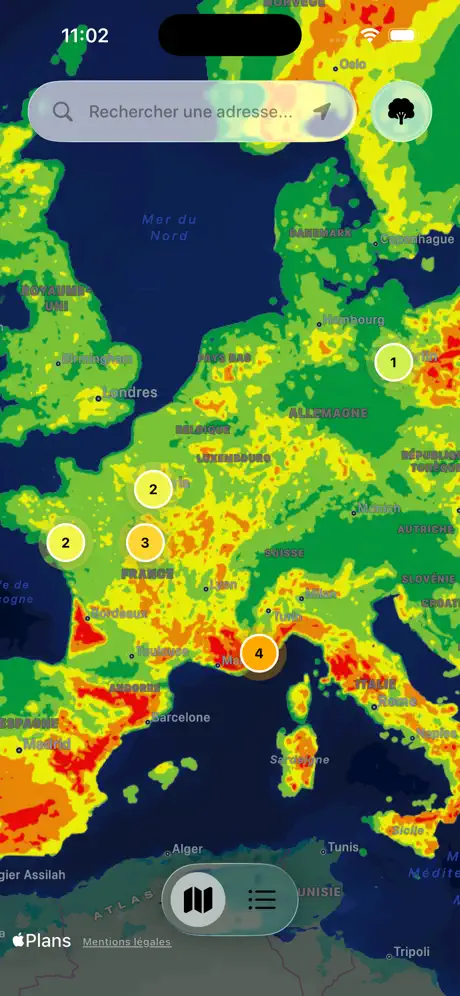
Pan anywhere and the overlay follows. Switch between the air quality layer and the pollen layer without leaving the map.
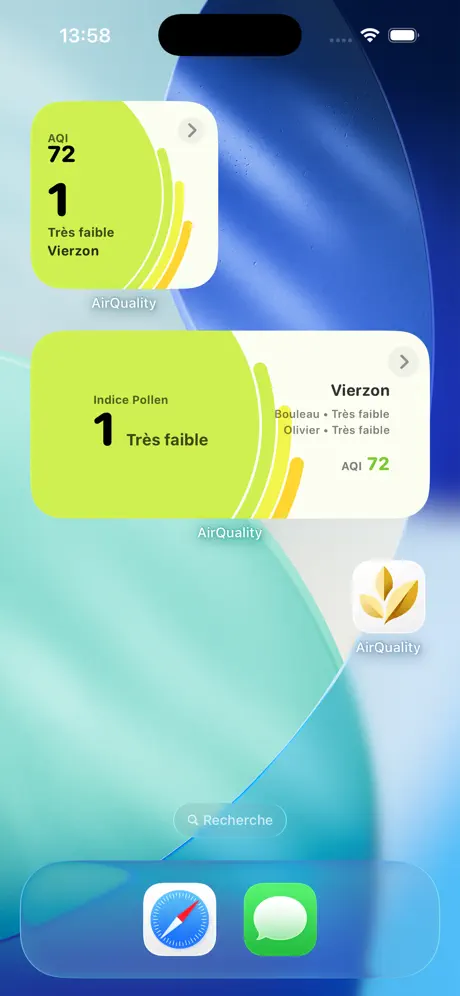
Small and medium widgets carry the index and the pollen level for your saved places, refreshed in the background.
Pollen
Air quality and pollen are two different problems. The app treats them that way: a separate five-day index per place, broken down by species, so you know whether it is the birch or the grasses that ruined your morning.
The overall figure hides which plant is responsible. Open a place and the app splits it out, so a bad week for ragweed does not read like a bad week for everything.
Across your devices
Saved places, the 72-hour chart, every pollutant and the map, in one pass.
Today's pollen index on the face you already wear, synced from the phone.
The pollen forecast for your saved places, rotating without opening anything.
English, French, German, Spanish and Italian — including the health advice itself.
Pricing
Reading the air costs nothing, and always will. Premium adds the five-day pollen forecast, the alerts, the widgets and the watch — with three days to decide.
The developer collects nothing from you. Your saved places live on your device, and the only thing that leaves it is the coordinate needed to ask for a reading.
It seems fair to know what is in it.